Core Web Vitals are three measurements of a real page, not a single speed score. Largest Contentful Paint asks how long the main content takes to appear. Interaction to Next Paint asks how long the page takes to respond when someone taps or clicks. Cumulative Layout Shift asks how much the page jumps around while it loads. Google publishes a 'good' line for each one. SiteScore reports the same three, from two different sources.
The three lines, in everyday language
- LCP, loading. Good is 2.5 seconds or under. Poor is over 4 seconds. This is usually the hero image, the main heading, or a large block of text.
- INP, responsiveness. Good is 200 milliseconds or under. Poor is over 500 milliseconds. This replaced First Input Delay. It watches responsiveness across the whole visit, not only the first tap.
- CLS, visual stability. Good is 0.1 or under. Poor is over 0.25. A score without units: it measures how far things move, not how long they take.
Between good and poor, Google calls the result 'needs improvement'. A page can pass two and fail one. Fix the one visitors feel. A layout that jumps as the webfont arrives is a CLS problem even when the server is fast. A page that paints quickly and then ignores taps for half a second is an INP problem.
A lab test and field data are not the same visit
Lighthouse, which SiteScore reads through PageSpeed Insights, loads the page in a controlled test. That is lab data. It is repeatable, and it is how you check a change before you ship it. The Chrome UX Report is field data: the 75th percentile of real Chrome users over the recent past. A lab LCP of 2 seconds and a field LCP of 4 seconds can both be true. The lab phone was on a fast connection. Your visitors were not.
INP is field data. Lighthouse does not produce it. In the performance report, INP appears only when the Chrome UX Report has enough traffic for the site. A quiet site can have lab LCP and CLS and no INP at all.
When field data exists, the performance category blends three inputs: a direct HTTP probe, the Lighthouse lab score, and the field categories for LCP, INP, and CLS. Good field data scores 100, needs improvement scores 60, and poor scores 20. Without field data, the blend is the probe plus Lighthouse only. The exact mix is on the methodology page.
What usually moves each number
LCP moves when the largest element arrives earlier. That is often an image without a declared size and without compression, a font that blocks rendering, or a server that takes more than a second to respond. The probe in the report already flags a slow response, a large HTML file, missing compression, and missing HTTPS.
INP moves when the browser is busy at the moment someone taps. Heavy scripts, tag managers, and chat widgets are the usual cause. CLS moves when something appears without a reserved space: an image with no width and height, a banner injected above the content, or a font that swaps and reflows the paragraph.
Fix the template, not a single URL. If the blog layout shifts, every article shifts. If the product image has no dimensions, every product page pays the CLS cost. The report groups issues that way so you can see the pattern. How to read a report covers that grouping.
Where this sits in the grade
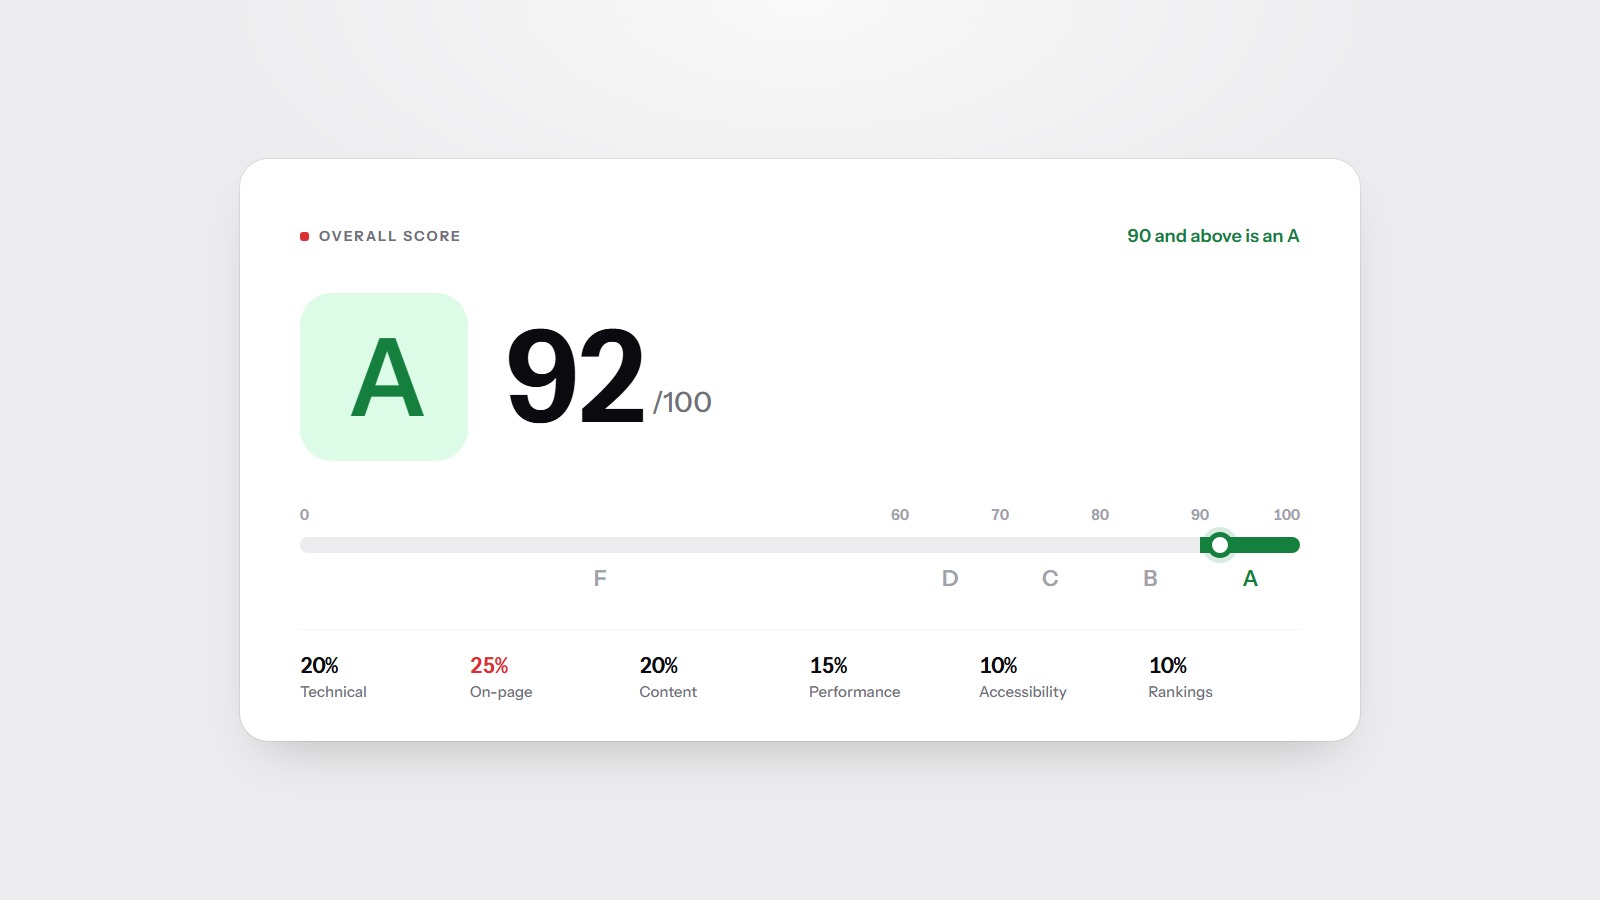
Performance is 15 percent of the overall score. It will not hide a blocked robots.txt or a site with no titles. It will pull a letter down when the measured speed is poor, and it will not move at all when the module was not run: that category stays at a neutral 75. What the score means explains that placeholder.
You do not need a perfect lab score to have a useful page. You need the main content to show up, the page to answer a tap, and the layout to stay still. Run the free scan to see whether performance data is available for your homepage, and read the field numbers ahead of the lab numbers when both are there. The field numbers are the visits you already had.